Contact Mode Force Calibration
To minimize or calculate the contact force between the tip and sample during Contact AFM, you must calibrate the contact force using the procedure below. This procedure is also a necessary precursor to Determine Cantilever Spring Constant by Thermal Tune.
Before you begin, some important considerations should be noted:
- Use an appropriate tip. For the Dimension Icon scanner, DNP-A is recommended.
- The sample surface must be hard, ensuring that as the probe pushes against the surface the cantilever is deflected without any corresponding deformation of the surface.
- The sample surface must be clean—contamination can result in force dissipation instead of cantilever bending.
- The Z scanner must be well calibrated.
The Deflection Sensitivity allows conversion from the raw photodiode signal (in volts) to deflection of the cantilever (in nm), and is normally set from the Ramp Continuous mode. The sensitivity must be calibrated before accurate deflection data can be obtained. Sensitivity is equal to the inverse of the slope of the force curve while the cantilever is in contact with a hard sample surface.
If sensitivity is calibrated on a material much stiffer than the cantilever, it measures the inverse of the value of the AFM’s optical lever sensitivity; i.e., how many volts of deflection signal are produced by a given deflection of the cantilever tip. The sensitivity will change for different cantilever lengths and styles. Sensitivity will also change with the position of the laser on the cantilever and the quality of the laser beam reflection from the cantilever.
Procedure
| |
- Set up your system for Contact Mode imaging.
- Ensure the SUM signal is maximized.
NOTE: Once the system is calibrated, do NOT touch any laser position controls or you will invalidate the calibration.
- Engage and begin scanning. The scan size is not important—before performing any force curves the system automatically locates the probe to the center of the scan area.
|

|
- Click the Ramp icon in the Workflow Toolbar to enter the Ramp view.
|
| |
- In the Mode section of the Parameter list, set:
- Trigger mode: Relative
- Trig threshold: 0.5 V
- In the Ramp section of the Parameter list, set Ramp size to 300–500 nm.
- In the main image panel, set the Channel 1 graph as follows:
- Data type: Deflection Error
- X Data Type: Z
- Set the Channel 2 graph as follows:
- Data type: Height Sensor
- X Data Type: Z
- Start ramping. You should see plots form similar to the ones below:
|

| |
- Click on the Channel 1 graph and drag a marquee to zoom in on the contact region.
- Drag vertical cursors from the plot edge to bracket the straightest portion of the contact region of the curve.
- Right click the graph and select:
- Active Curve > 1 to use the trace line (blue)
- Active Curve > 2 to use the retrace line (red; recommended)
|


|
- Click the Update Sensitivity button in the at the top of the main window. This will open the Set Realtime Channel Sensitivities window:
|

| |
The measured Deflection Error sensitivity is displayed at the top of this dialog. Enabling the check boxes below sets the given variable to the measured Deflection Error sensitivity.
- The Deflection Sensitivity & TM Deflection Error Sens. box must be checked for you to use NanoScope's Thermal Tune functionality.
- The other check boxes are not normally necessary for Contact Mode imaging.
- Click OK to accept the computed sensitivity.
|
To confirm the Deflection Error sensitivity was set, go to Calibrate > Detector in the NanoScope menu bar. This opens the Detector Calibration window:
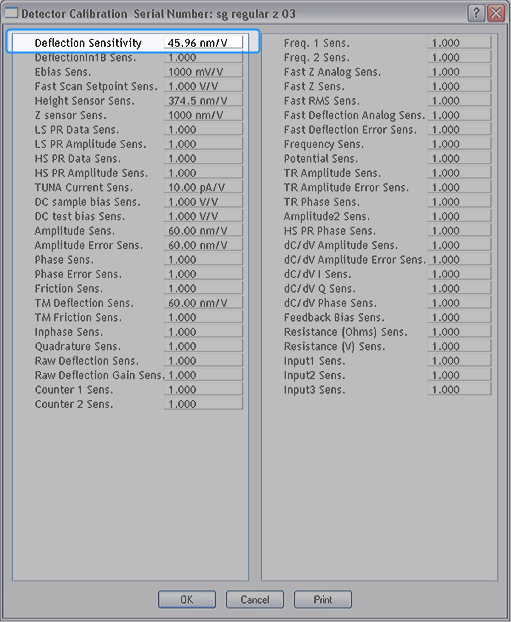
This sensitivity, given in nanometers, will be used for thermal tune, when collecting force curves, and other relevant applications.
The force curves used for this calibration have made use of the Deflection Error vs Z plot, which gives a graphical representation of the deflection error compared to the Z piezo position. Most users will be more interested in the Deflection Error as it compares to the separation between the probe tip and sample surface. Because the probe tip is cantilevered some distance away from the actual Z piezo, further information must be included to get an accurate indicator of tip position. NanoScope can calculate this automatically.

|
- Select Expanded Mode.
|
| |
- In the parameters list, under Channel 1, set the Display Mode to Deflection Error vs Separation.
- Begin ramping.
- The Deflection Error vs Separation plot will be displayed:
|

 Related Topics
| www.bruker.com
|
Bruker Corporation |
| www.brukerafmprobes.com
|
112 Robin Hill Rd. |
| nanoscaleworld.bruker-axs.com/nanoscaleworld/
|
Santa Barbara, CA 93117 |
| |
|
| |
Customer Support: (800) 873-9750 |
| |
Copyright 2010, 2011. All Rights Reserved. |
Open topic with navigation